

Session identity and lifecycle
Every session has a unique ID in the formats-<uuid> and belongs to one tenant and one project. The platform binds each session to the agent configuration of the environment it runs in.
- Creation: the platform creates a session when a user starts a conversation on any channel: the first message in a messaging app or the Web SDK, the start of a voice call, or the first request from an API or SDK client. On SDK and API channels, your application decides when a new session starts. The Web SDK raises a
sessionStartevent with the new session ID. See Web SDK. - Continuation: while a session is open, every new message from the same user joins it, so the agents keep the full history and state. On asynchronous channels, such as WhatsApp, SMS, and email, the session stays open through long gaps, and the platform tracks each period of activity as a segment.
- Handoff: when a supervisor hands off to a specialist agent, the session and its ID stay the same. The platform opens a thread for the specialist inside the session and returns to the parent thread when the specialist finishes. See Session hierarchy in multi-agent systems.
- Closure: the session closes when the agent completes, the user leaves, a timeout fires, or a transfer ends the conversation. The idle timeout and the maximum session age come from your tenant configuration, and Studio has no setting for them. The Summary tab shows the values that apply. See Session closure.
- Archival: after the retention period ends, the platform moves the session to cold storage and sets its status to Archived. Your deployment configuration sets the retention period. You can still open archived sessions on the Sessions page.
What a session includes
A session holds everything the agents need to continue the conversation, and everything you need to investigate it later:- Conversation history: every user message, agent reply, and tool call, in order. The agents receive this history on each turn.
- Session state: the variables that the agents collect, such as gathered field values, tool results, and
SETvalues. See Session memory. - Context: values that the channel passes in, such as metadata, language, and locale, and values that one agent passes to another during a handoff.
- Threads: the stack of agents that took part, created by handoffs.
- Trace events: a record of every step that the agents ran, with its timing, inputs, and outputs.
- Metrics: messages, tokens, cost, and duration.
- Recording: the call audio, for voice sessions with recording turned on.
Session structure
Every session breaks down the same way, and the detail page follows this structure:- Turns. Each time the user speaks or types, the agents respond in a turn. A five-question conversation has about five turns.
- Steps. Inside a turn, the agents run steps: routing decisions, model calls, tool calls, memory updates, guardrail checks, and the final response.
- Events. Every step writes one or more trace events with its timing, inputs, and outputs. The session page builds every view from these events.
Investigate a session
Most investigations start with a report like “the agent asked for my number twice” or “the call went quiet for ten seconds.” Follow these steps to trace the report to its cause.1
Find the session
Go to Operate > Sessions. If you have the session ID, search for it. If you know only the user, filter by Caller phone number for voice or Channel UID for digital channels. See Find a session.
2
Read the conversation first
Select the session ID. Before you look at the trace, read the conversation on the Timeline tab and find the message where the problem started. That message tells you which turn to open.
3
Let the page find the problems
Select the issue count in the trace toolbar to hide every step that ran without issues, or press N to jump to the next error or warning. A failed tool call or a guardrail block often explains the problem.
4
Open the step that matters
Select the step and press Enter to open the inspector. If the agent said something unexpected, open the model call before the reply and select Request to see what the model received.
5
Check time and sound for voice calls
For a slow agent, switch the trace to Latency and find the longest step. For an audio problem, play the recording from that message and open Voice Quality.
6
Keep the evidence
Select Export JSON to save the session for a support ticket or offline analysis. See Export a session.
Find a session
The sessions list opens on Conversations for the last seven days across all environments. Select Traces to list individual trace runs instead, such as evaluation or workflow runs.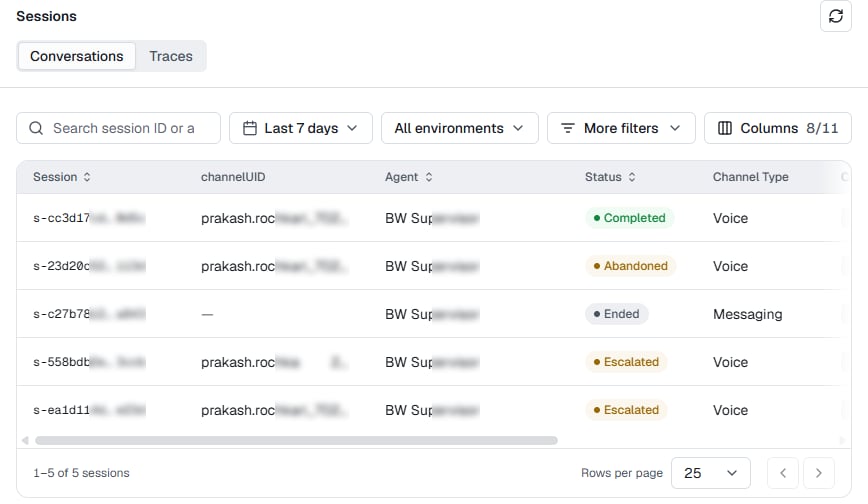
Sessions list with the Channel UID column turned on
- A customer complains about a call: filter by Caller phone number to list every session from that caller, and then sort by Created.
- A customer complains on a digital channel: filter by Channel UID, the user’s identifier on the channel, such as an email address or a phone number with the country code.
- Escalations increase: set Status to Escalated and Channel Type to Voice to list the calls that went to a human.
- Test sessions skew production numbers: set Source to User initiated to leave out evaluations, synthetic runs, and debug sessions.
Column reference
Column reference
Filter reference
Filter reference
Read the session page
Select a session ID to open it. The header and tabs stay at the top while you scroll.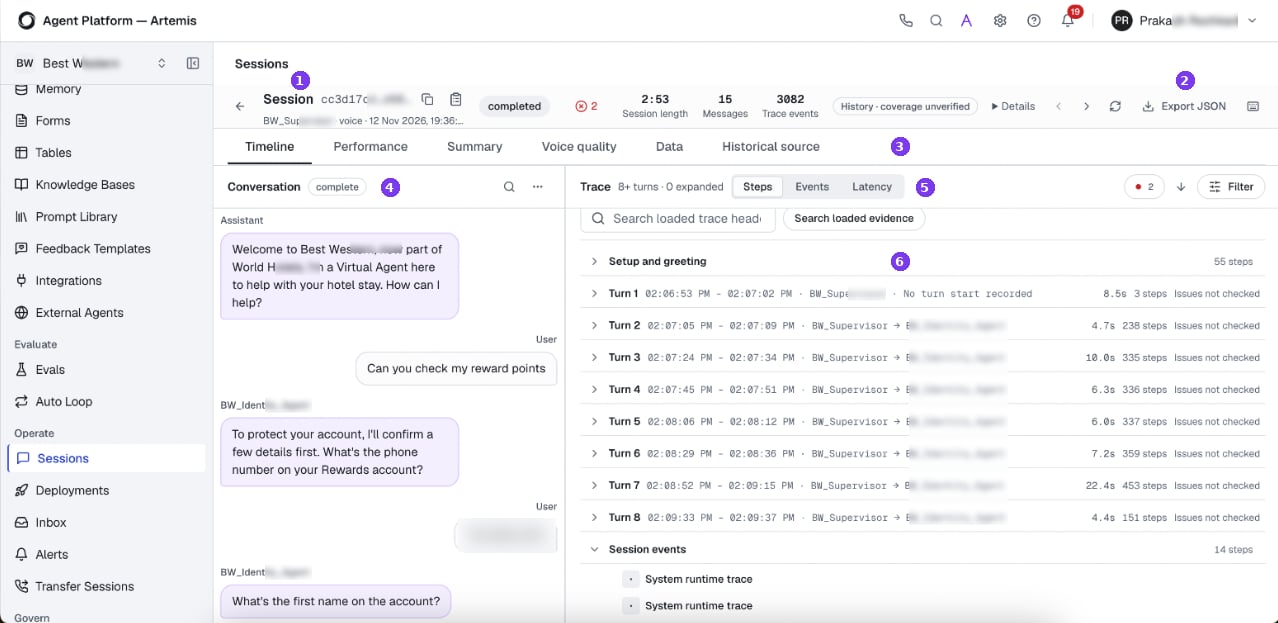
Session detail page
- Header. Shows the session’s status, error and warning count, length, message count, and trace event count. When the status and the disposition differ, the header shows both, such as
escalated · transferred. - Header actions. Open Details for the session facts, step to the previous or next session in the list, select Refresh snapshot to follow a call that’s still running, select Export JSON, or open the keyboard shortcuts.
- Tabs. Each tab answers a different question. Timeline shows what happened, Performance shows what it cost and how fast it ran, Summary shows why it ended, Voice Quality shows how the call sounded, Data shows what the agent stored, and Historical source shows which agent definition ran.
- Conversation pane. What the user and each agent said, in order.
- Trace views. Switch the trace between Steps, Events, and Latency.
- Trace. Every turn, and every step inside it.
The page works from a snapshot of the session. If the page shows This session snapshot expired, select Refresh snapshot. If the header shows History · coverage unverified, the page can’t confirm that it loaded every recorded event. Refresh the snapshot, or load older and newer ranges from the trace.
Export a session
To save a session for a support ticket or offline analysis, select Export JSON in the header. Your browser downloadsdebug-trace-<session-id>-<timestamp>.json, which holds the session identifiers, every trace event, every message, and a completeness check.
The export applies the same protection as the session page. The platform always masks credentials and secrets, and it redacts personal data according to the project’s PII protection settings.
Follow the conversation on the Timeline tab
The Timeline tab shows the conversation and the trace side by side, so you can read a message and review the work behind it in one view. To give either pane more room, drag the divider.Read the conversation
The conversation pane labels each message with its speaker: User, Assistant, or the agent that answered, such as a specialist that the supervisor handed off to. A change of agent name shows where a handoff happened. Hover over a message and select Inspect message to open its recorded details, or Play from here to hear that moment of a voice call. To find a phrase, select the search icon. To load older or newer messages, refresh them, or follow a live session, select the more icon.Read the trace
The trace shows the work that the agents did for each message. Choose the view that fits your question:- Steps: review each turn
- Events: check the sequence
- Latency: find slow steps
Start here. The trace opens with Setup and greeting, then one row for each turn, then Session events, such as the end of the call.Each turn row shows when the turn ran, which agents took part, such as
Supervisor → Identity_Agent, how long it took, and how many steps it ran.Expand a turn to see its steps. The trace folds repeated steps into one row, such as Routing & checks ×10. For a long turn, select Show more steps.- Issue count shows the errors and warnings in the loaded range. Select it to hide every step that ran without issues, and select the down arrow to go to the next issue.
- Search loaded trace headers finds steps by name. Search loaded evidence searches the recorded content instead. Use it when you know a value, such as an order number, but not the step that used it.
- Filter shows or hides steps by family, such as Model, Tools, or Guardrails, by recorded category, or by severity. For example, turn off Plumbing and Runtime to hide system rows.
- The more icon loads an Older range or Newer range when the trace is too long to load at once.
Inspect a step
The inspector shows everything that the platform recorded for one step or message. Select a row and press Enter, or select Inspect message on a message. To move to a neighboring row without closing the inspector, select the arrows at the top. Start with Summary, which shows when the step ran, how long it took, which turn and agent it belonged to, whether it recorded an issue, and the key details for that kind of step. For a call-connected event, for example, the key details include the call IDs and speech providers. For a model call, two more tabs appear. Request shows the model, provider, provider options, and model parameters. For a large request, the tab shows Download full value instead, which saves the complete request as JSON, including the system prompt, messages, and tools. Response shows the model’s reply and any tool calls that the model made. Together, these tabs tell you whether the model received bad input or handled good input badly. Payload shows the step’s recorded data in a JSON viewer, Events lists related steps, and Raw shows the event exactly as the platform stored it. Include Raw when you report a bug.Listen to the recording
For voice sessions with recording turned on, the Recording panel appears above the conversation. Listen to the call to settle questions that the trace can’t answer, such as whether the caller paused, talked over the agent, or spoke unclearly.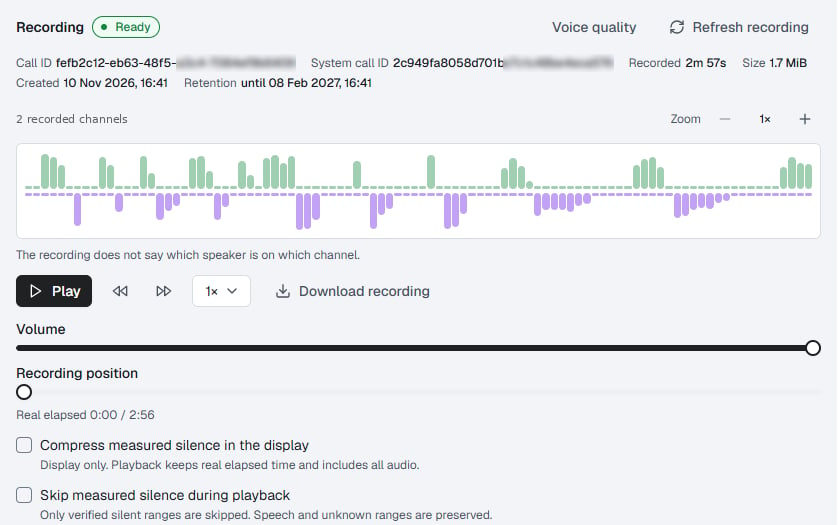
Recording panel with the waveform loaded
1
Load the recording
Select Load recording. The panel draws a waveform for each recorded channel and measures the silences.
2
Go to the moment that matters
Select Play from here on the message, or the headphone icon on a trace row. You can also select a row, and then select Play from selection.
3
Control playback
Select Play. Skip back or forward 10 seconds, change the speed, or drag Recording position. To see short pauses, use Zoom.
4
Keep a copy
Select Download recording to save the audio.
Recording states
Recording states
The badge next to Recording shows whether you can play the call.
The panel also shows the Call ID and System call ID, which your telephony provider needs when you report a call problem.
Requirements and retention
Requirements and retention
You can play or download a recording only when call recording is on for the project and you have the View Recordings permission, which every system role has by default. See Call recording.The platform keeps a recording until its Retention date, and then deletes the audio. Because deletion runs on a schedule, a recording can stay available for up to an hour after that date. A project admin or owner can change the retention period in the project’s Settings > Recording.
Compliance
Compliance
The platform doesn’t play a “this call is recorded” notice. If your region requires consent or notice, add it to the agent’s opening prompt.The platform stores recordings in the storage that your workspace uses. To keep audio in a specific region, use your own storage account.
Turn recording off
Turn recording off
To stop recording new calls in one project, turn off Enable call recording in the project’s Settings > Recording. Existing recordings stay playable.To hide recording across the workspace, turn off the workspace Call Recording switch. Every project hides its recording settings and audio, and the platform deletes nothing. To remove the feature completely, contact the support team.
Check speed and cost on the Performance tab
Open Performance when the question is “why was this slow?” or “why did this cost so much?”- Overview
- Model and tool exchanges
- Logs
Shows the totals for the session (trace events, LLM calls, tool calls, total tokens, and duration) and an execution tree of every step with its agent and duration. Far more LLM calls than turns can mean that an agent is looping or retrying.
Understand how the session ended on the Summary tab
The Summary tab explains the session’s outcome. Details in the header shows the same facts without leaving the tab you’re on. The facts answer three questions:- How long did it last, and how engaged was the user? Duration is the full session length, while Engaged time counts only the time the user actively took part. A long duration with little engaged time means the session stayed open while it waited for the user. Segments counts separate periods of activity, which matters on channels such as WhatsApp where a user can come back hours later.
- Who handled it? Final agent is the agent that handled the session last, and Escalated to a human shows whether it went to a person. Deployment shows the deployment it ran on; None recorded means the working copy.
- Why did it end? Persisted disposition records the reason, such as
completed,timeout, ortransferred. See Dispositions.
Diagnose call quality on the Voice Quality tab
Voice Quality appears for voice sessions. It reads the call’s voice evidence in batches, so the cards fill in as it loads. If loading stops early, select Continue reading or Read again.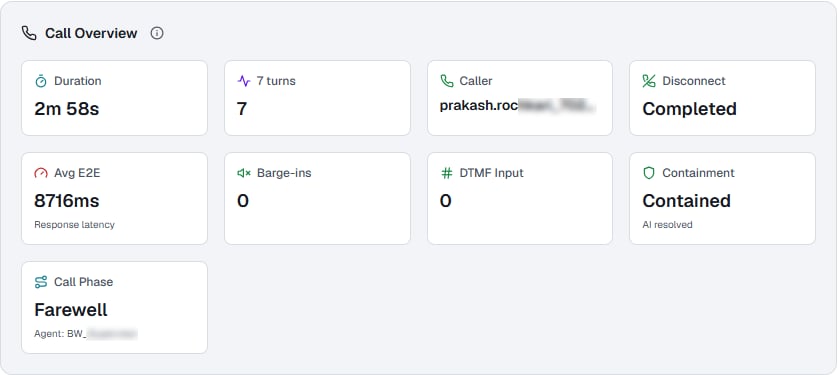
Call Overview card
- The agent was slow
- The caller kept interrupting
- The call sounded bad
- The call dropped
Check Avg E2E in Call Overview, the average time from the caller finishing to hearing the answer. Then open Turn latency to find the slow turns. End-to-end latency is green under 800 ms, amber under 1,500 ms, and red above.Call Activity splits the call’s silence into Processing, the time spent on models and tools, and Dead Air, the gaps where nothing happened. High processing time sends you to the Performance tab. High dead air points to turn detection or speech timeout settings.
Card reference
Card reference
See what the agent stored on the Data tab
Open Data when the conversation looks right but the outcome is wrong, for example when the agent asked for an order number, the user gave it, and the next step still failed. The tab shows what the agent actually stored. It reads the saved session record, not the agent editor. Raw sections is the quickest place to look: Session state, Gather, and Context show the values the agent held. The other tabs focus on one kind of data: Gather overview shows which fields the agent collected and which it’s still missing, Phase shows where the conversation was, Flow and Constraints show flow progress and constraint results, Session memory shows memory values, and Full state shows everything at once. Select Download full value to save the masked data as JSON, or Refresh recorded data to reload it.Compare agent versions on the Historical source tab
Agents change. When a session behaved differently from the agent you see today, use the Historical source tab to review the definition that ran.1
Choose the agent
Select an agent. The list includes the entry agent and every agent recorded on the loaded trace page, so a handoff target is there too.
2
Choose what to compare
Select Recorded source for the definition that ran during the session, or Current draft for the agent as it is now. Switch between them to spot the change.
3
Read the definition
Select DSL for the ABL source, Compiled IR for the compiled version, or Recorded test context for the test conditions.
The platform doesn’t record a source for sessions that ran the working copy. Deploy a version so that each session keeps the definition it ran.
Work faster with keyboard shortcuts
Press ? on the session page to see every shortcut. Shortcuts act on the focused pane, so the same arrow keys move through trace rows in the trace and seek through audio in the recording. The ones you’ll use most:- N and Shift+N jump to the next or previous issue.
- Enter inspects the focused row, and [ and ] step through rows while the inspector stays open.
- / searches the focused pane, and Esc closes whatever is open.
- Space plays or pauses the recording.
All shortcuts
All shortcuts
To turn off single-letter shortcuts, clear Enable optional character shortcuts in the shortcuts dialog.
Access sessions through the API
Use the public APIs to pull session data into your own reports, data warehouse, or monitoring tools.List session summaries
One row per session, with channel, outcome, messages, tokens, and cost.
List conversation messages
Messages in time order, with the project’s PII policy applied.
List traces
Trace events for sessions.
List LLM calls
Model calls with tokens and cost.
Fetch calls per session
Call recordings for a session.
Session statuses
A session’s status shows where the session is in its life. While the conversation runs, the session switches between Active, when an agent is working, and Idle, when the agent waits for the user. When the session closes, it takes one final status. After the retention period that your deployment configuration sets, the platform archives it.- Completed: the agent finished by calling
COMPLETE. This is the outcome you design for. - Escalated: a human or another system took over.
- Abandoned: the user left during an idle period, or the agent side dropped the conversation.
- Ended: the user ended the session, or a timeout closed it.
- Failed: a fatal error or a guardrail violation ended it.
completed.
Session closure
When a session closes, the platform saves any pending conversation data, records the final status and disposition, publishes a completion event for downstream services, and releases the session’s resources. It also finalizes billing and reporting. The platform bills by session, and uses each session’s duration and engaged time for metrics such as containment, resolution, and abandonment rates.Dispositions
The disposition records why the session ended, and the platform derives the final status from it.How a session closes
A session closes in one of three ways:- The agent completes
- A timeout fires
- A transfer ends
Design most sessions to end this way. Define completion conditions in the agent’s The platform checks conditions in order and applies the first match. In a multi-agent setup, put the
COMPLETE block. When a condition matches, the agent sends its final response and closes the session as completed.COMPLETE block in the agent that owns the conversation, such as the supervisor or a dedicated closing agent. A COMPLETE in a child agent that returns to its parent ends only the child’s work, not the conversation.To end an interaction without closing the session, set TERMINAL: false. The user’s next message then starts a new interaction in the same session. See COMPLETE.